amCharts
The most capable data visualization library on the web.
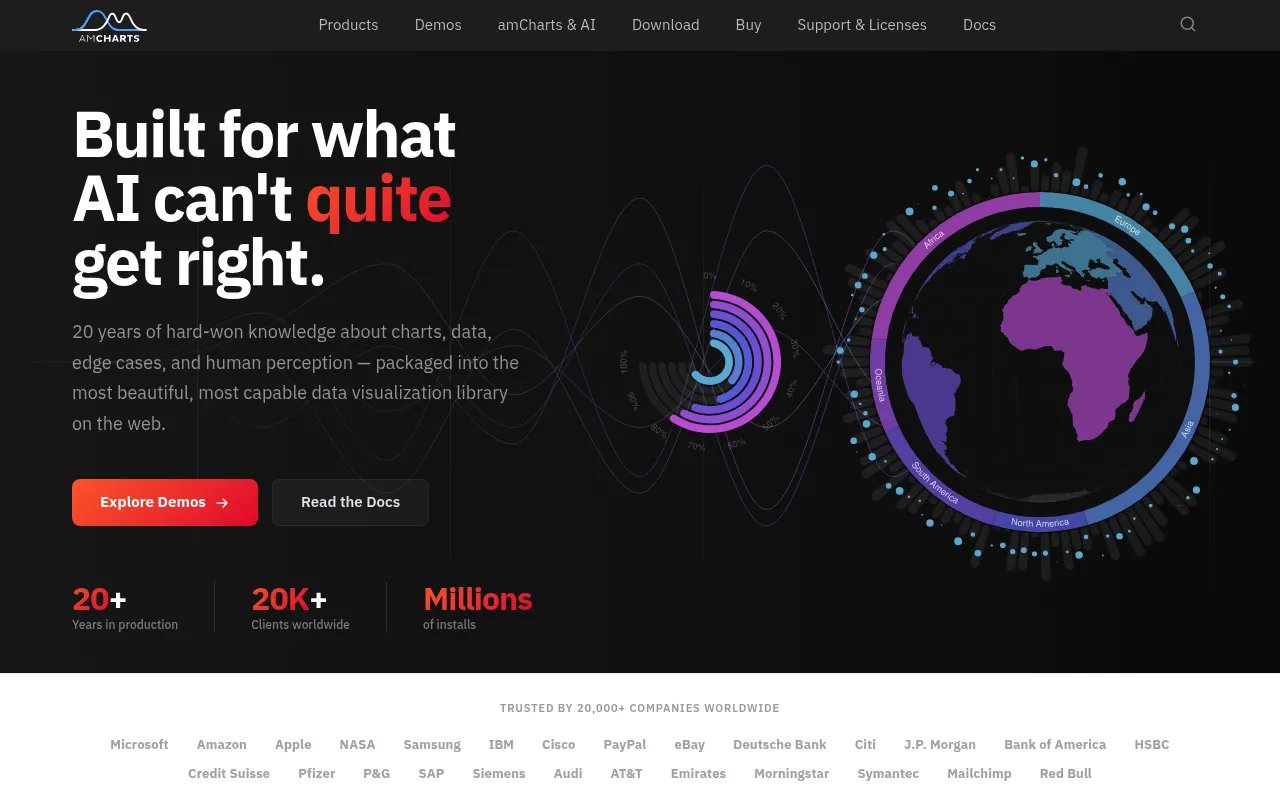
amCharts is a JavaScript data visualization platform offering 60+ chart types including maps, financial stock charts, and Gantt diagrams. It is built on HTML5 Canvas for performance and includes animations, accessibility features, and AI-friendly tooling such as MCP servers and skill files. It has been in production for over 20 years and is trusted by thousands of companies worldwide.
Developers integrate the amCharts JavaScript library into their projects, select from 60+ chart types, and configure them via a comprehensive API; AI tools like MCP servers and skill files help generate correct amCharts code automatically.
Software developers and data engineers building interactive data visualizations and dashboards
Background.
- Status
- launched
- Business model
- freemium
- Company
- amCharts
- Launched
- 2006
Similar projects.
Editorial take on the space this project sits in — momentum signals, adjacent moves, our call on whether the wedge is real. Get pinged when we publish a new read or when the landscape shifts.
Have a take on this space?
Tell us what you’d build differently, where you think the incumbents miss, or what we’ve gotten wrong about this project. Comments + reactions are coming soon.