ApexCharts.js
Interactive charts your users will love, built for developers.
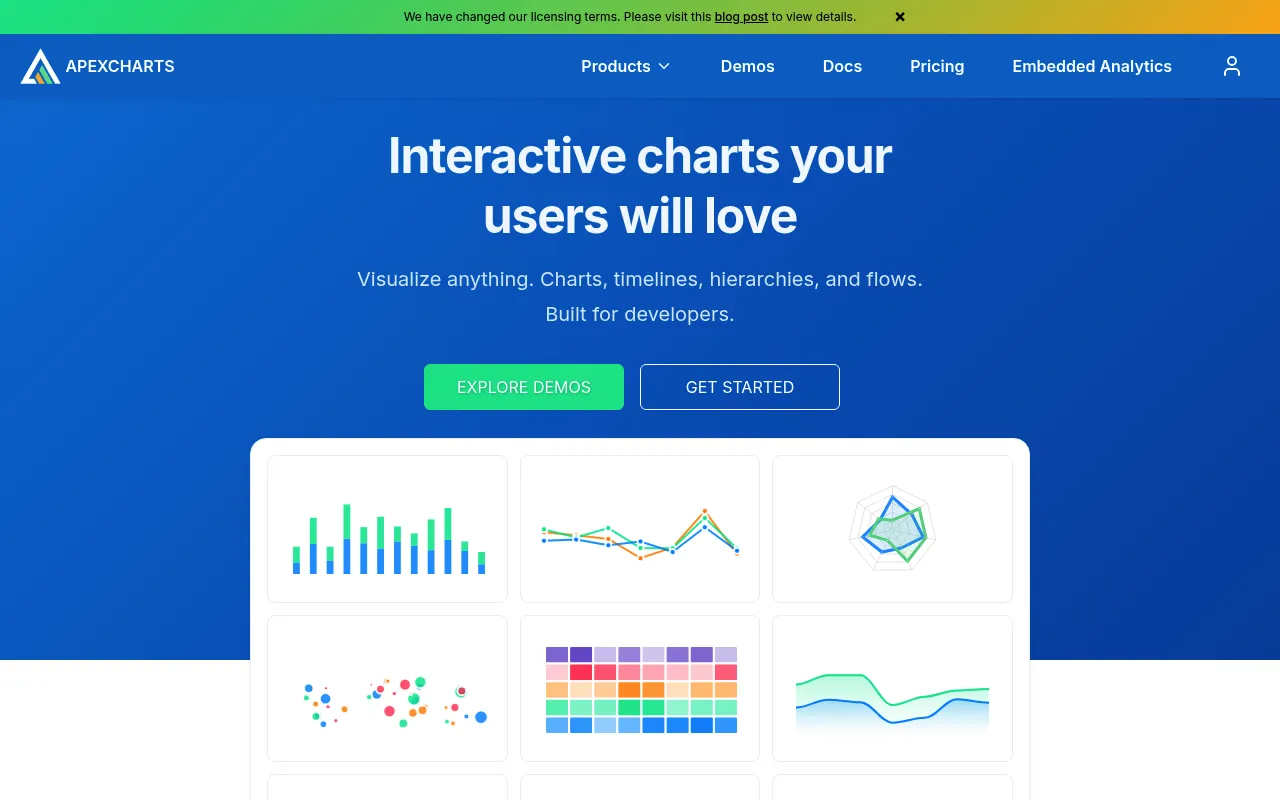
ApexCharts.js is an open-source JavaScript charting library that enables developers to build interactive, responsive charts and data visualizations with a simple API. It supports over 20 chart types including bars, timelines, hierarchies, and flows, and integrates with frameworks like React, Angular, and Vue. The library boasts over 15,000 GitHub stars and 6 million monthly npm downloads.
Developers install the library via npm and configure charts using a simple JavaScript API with extensive documentation and 100+ ready-to-use samples.
web developers and front-end engineers
Background.
- Status
- launched
- Business model
- open-source
Similar projects.
Editorial take on the space this project sits in — momentum signals, adjacent moves, our call on whether the wedge is real. Get pinged when we publish a new read or when the landscape shifts.
Have a take on this space?
Tell us what you’d build differently, where you think the incumbents miss, or what we’ve gotten wrong about this project. Comments + reactions are coming soon.