DAGraph
Local-first analytical SQL in your browser with a reactive graph
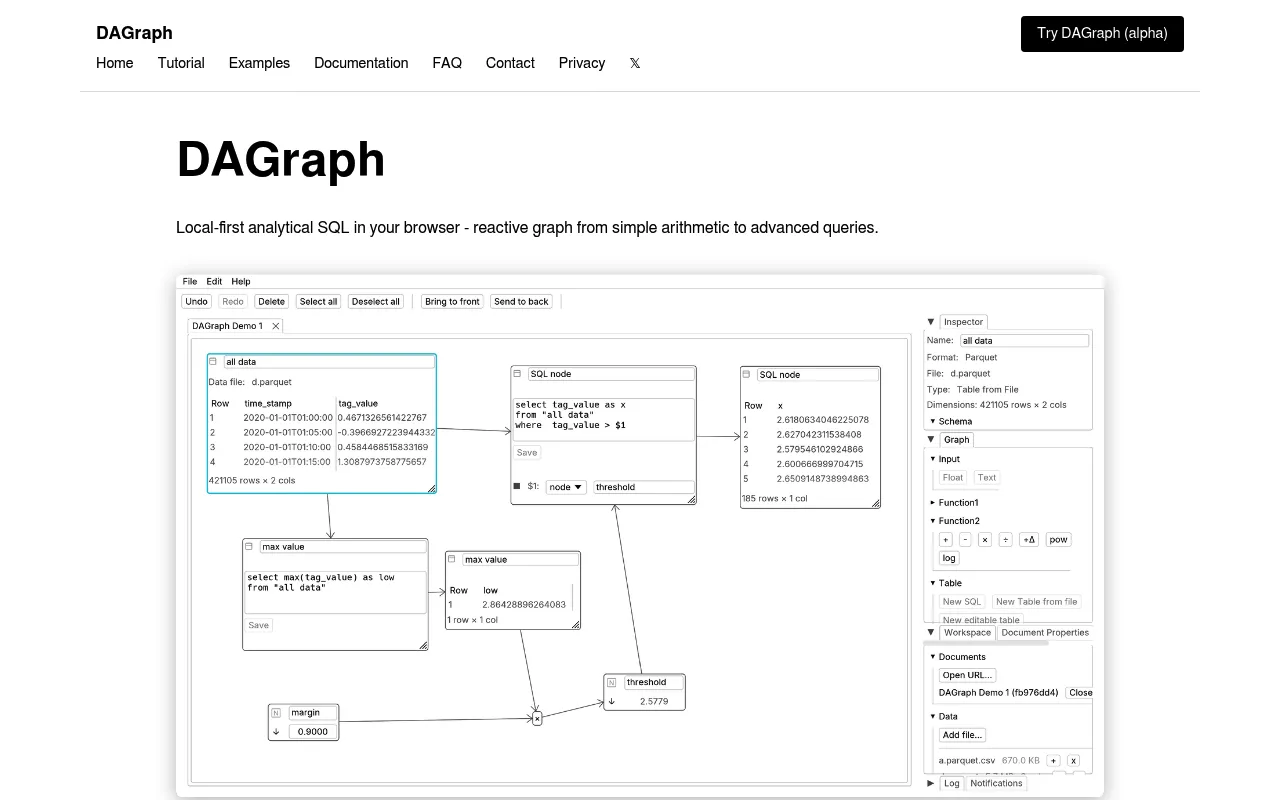
DAGraph is a browser-based, local-first SQL analytics tool that lets users build reactive data pipelines on an infinite canvas. It supports SQL queries, arithmetic nodes, and Parquet/CSV imports, with all computation running locally via WebAssembly. It is aimed at everyone from beginners to data engineers who need to prototype ETL pipelines or break down complex SQL into modular visual workflows.
Users build a reactive node graph in the browser where SQL queries, arithmetic operations, and data tables are linked together and auto-refresh when inputs change, all running locally via WASM.
Data analysts, data engineers, power users, and beginners working with SQL and tabular data
Background.
- Status
- launched
- Business model
- freemium
Contact
Similar projects.
Editorial take on the space this project sits in — momentum signals, adjacent moves, our call on whether the wedge is real. Get pinged when we publish a new read or when the landscape shifts.
Have a take on this space?
Tell us what you’d build differently, where you think the incumbents miss, or what we’ve gotten wrong about this project. Comments + reactions are coming soon.